Modelado Oceano - Atmosfera.
LABORATORIO DE MODELADO OCEANOGRÁFICO, ECOSISTÉMICO Y DEL CAMBIO CLIMÁTICO
Usando un modelo acoplado oceánico-atmósfera de complejidad intermedia se simularon las ondas Kelvin en el Pacífico Tropical, siguiendo la metodología de Dewitte et al. (2002, 1999). El componente oceánico consiste de un modelo lineal con 3 modos baroclínicos, forzado con vientos NCEP actualizados hasta el 31 de julio 2014 (Kalnay et al. 1996). La proyección de las ondas Kelvin hasta el 30 de setiembre 2014 se realiza sin el forzante de vientos, y para el cálculo de las anomalías se usó como periodo base del 2000-2008.
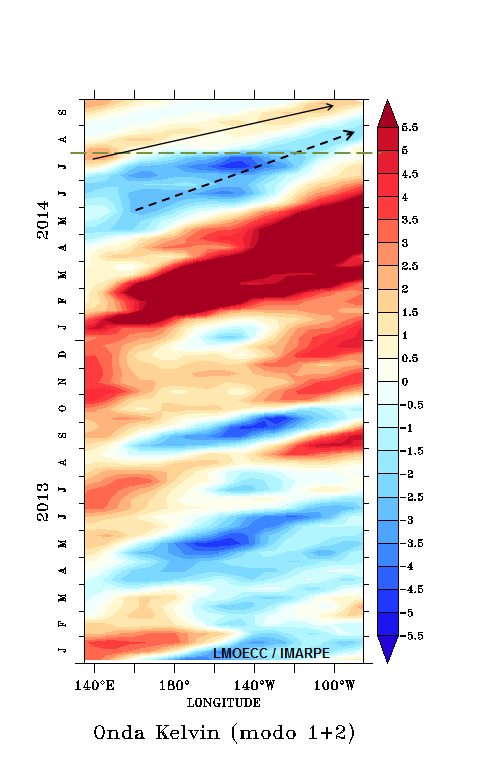
Se graficó la contribución de los modos baroclínicos 1 y 2 de las ondas Kelvin a las anomalías del nivel del mar (cm) en el Pacifico Ecuatorial. La Fig. 1 muestra la contribución de los modos 1 y 2 de las ondas Kelvin (OK) y la Fig. 2 muestra la contribución conjunta de los modos baroclínicos 1+2 de las ondas Kelvin. Los valores positivos corresponden a ondas Kelvin tipo ?hundimiento o cálidas? y los valores negativos corresponden a ondas Kelvin tipo ?afloramiento o frías?.
Según la simulación de la propagación de ondas Kelvin a lo largo del Pacifico Ecuatorial, una onda Kelvin fría (modo 2) se generó en mayo 2014, debido a los vientos alisios del pacifico ecuatorial occidental y llegaría a la costas de Sudamérica en agosto 2014. Por otro lado una onda Kelvin cálida (modo 1) se generó en julio 2014 debido a la reflexión de una onda Rossby cálida y llegaría a las costas de Sudamérica entre setiembre y octubre 2014.
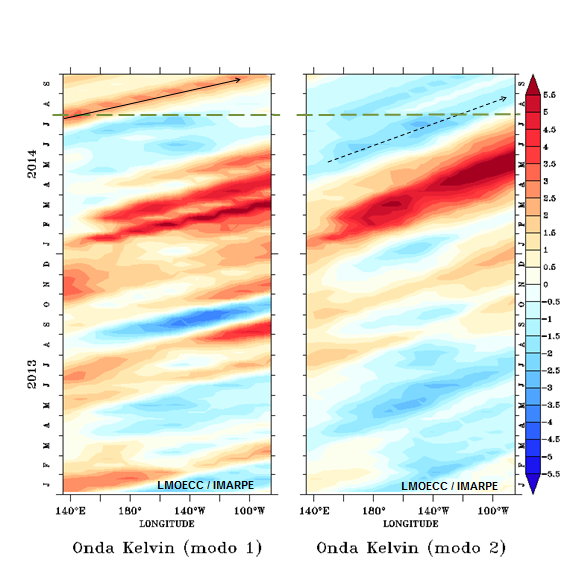
Figura 1. Diagrama Hovmöller longitud-tiempo de las ondas Kelvin: modo baroclínico 1 (línea continua) y modo baroclínico 2 (línea punteada), en el Pacifico Ecuatorial (0°N). Para el cálculo de las anomalías se usó el periodo 2000-2008. La línea discontinua horizontal indica el inicio del pronóstico.
Bibliografía
Dewitte B., G. Reverdin and C. Maes, 1999: Vertical structure of an OGCM simulation of the equatorial Pacific Ocean in 1985-1994.J. Phys. Oceanogr., 29, 1542-1570.
Dewitte B., D. Gushchina, Y. duPenhoat and S. Lakeev, 2002: On the importance of subsurface variability for ENSO simulation and prediction with intermediate coupled models of the Tropical Pacific: A case study for the 1997-1998 El Niño. Geoph. Res. Lett., vol. 29, no. 14, 1666, 10.1029/2001GL014452.
Illig, S., B. Dewitte, N. Ayoub, Y. du Penhoat, G. Reverdin, P. De Mey, F. Bonjean and G.S.E. Lagerloef. 2004. Interannual long equatorial waves in the Tropical Atlantic from a high resolution OGCM experiment in 1981?2000, J. Geophys. Res. 109 (C2): C02022.
Kalnay et al. 1996. The NCEP/NCAR 40-year reanalysis project, Bull. Amer. Meteor. Soc., 77 , 437-470.
- INFORMES QUE SUSTENTAN RESOLUCIONES MINISTERIALES
- REPORTE DE LA ACTIVIDAD
PESQUERA - SERVICIO DE INFORMACIÓN OCEANOGRÁFICA DEL FENÓMENO EL NIÑO
- GUÍAS DE IDENTIFICACIÓN - ESPECIES MARINAS
- COMISIÓN MULTISECTORIAL ESTUDIO NACIONAL FENÓMENO EL NIÑO
- PROG. INT. CONSERVACIÓN DE DELFINES (APICD)
- IMÁGENES SATELITALES
- REPOSITORIO DIGITAL
- SERVICIOS
- MACROALGAS
- PLAN DE ACCIÓN - TIBURÓN
- VARAMIENTO - MORTANDAD DE FAUNA MARINA
- FLORACIONES ALGALES NOCIVAS
- BANCO DE GERMOPLASMA ORGANISMOS ACUÁTCOS
- CONVOCATORIA
- KOPE–LAR
 ATENCIÓN AL CIUDADANO
 SISTEMA DE CONTROL INTERNO
 RENDICIÓN DE CUENTAS (VIÁTICOS Y ENCARGOS)
 GALERÍA DE FOTOS
 GALERÍA DE VIDEOS
 BUSCAR


Todos los Derechos Reservados N° 2013. Instituto del Mar del Perú IMARPE
Esquina Gamarra y General Valle S/N Chucuito Callao
Horario de atención: 08:00 - 16:30 Hrs.
Telf: (051)208-8650